Gaps in the National Drug Treatment Monitoring System
Last week the National Treatment Agency (NTA) for Substance Misuse published its numbers for 2010/11 – numbers that are badged as national statistics.
Briefly, 204,500 clients (to nearest 100) aged 18 years and over were in contact with structured treatment during 2010/11.
New presentations to treatment in 2010/11, which means individuals who were not previously in drug treatment in that year but may have been in previous years, were just over 74,000. Their age-distribution and pattern of primary drug use differed from other clients in contact with structured treatment in 2010/11, as summarised in Table 1.
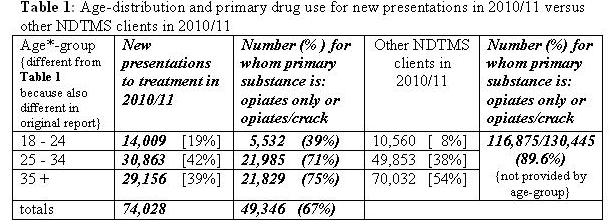
The NTA drew attention to the primary substance of new presentations in 2010/11 being different by age-group: opiates were implicated for only 39 per cent of new presentations in 2010/11 who were aged 18-24. Ideally, we’d like to see the 2009/10 & earlier versions to judge whether this is an enduring or recent feature of young people’s usage.
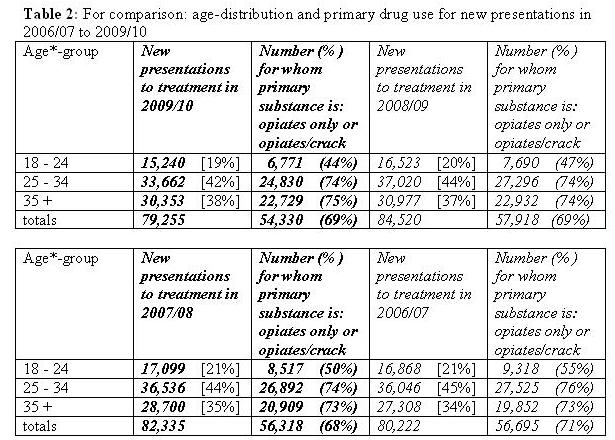
Table 2 offers just this comparison for new presentations only. The age-distribution of new presentations for treatment in 2010/11 has not changed substantially from that of new presentations in 2006/07 but, over the 5-years, there has been a steady decline in the number (from 9,300 to 5,500: to nearest 100) and percentage (from 50 per cent to 39 per cent) of new presentations aged 18-24 whose primary drug use was opiate-related.
There is little equivalent comfort – at least in percentage terms - in the two older age-groups’ new presentations over the five years. However, 2010/11 has marked a down-turn in actual number of older opiate-related presentations from typically over 47,000 in each to the preceding four years to below 44,000. Has recovery become better entrenched, I wonder?
To answer that question, I’d like to know: for each annual cohort of opiate-related clients for whom NTA discharge-status was “treatment complete”, what their subsequent hazards were, such as risk of re-presentation for drug treatment versus risk of early death.
There are two reasons that I can’t work this out.
First, despite opiate-users’ high risk of early death – notably drugs-related or by suicide – the NTA gives no account of clients’ and ex-clients’ mortality within 3 months, 1 year, 2 years and 5 years of NTA discharge as “treatment complete”. Why not? Perhaps because timely information on the deaths of NTA’s discharged clients is, of course, hard to come by in England, where there is no requirement that even the fact of death be notified to the Registrar General/Office for National Statistics within 8 days of the death having been ascertained.
The delay between occurrence of heroin-related death and its registration on completion of coroner’s inquest is more than a year if analysts want to be sure that at least 90 per cent of deaths have been registered. Little wonder that NTA does not give a timely account of the mortality of its ex-clients.
However, their deaths matter. And how few (or many) deaths there are is a measure of how successful the “completed treatment” truly was.
The reason that I can’t even work out time to 1st re-presentation is different. My problem is that the treatment-completers who re-present are subsumed within NTA’s “clients retained in treatment on 31 March 2011” or within “no longer in contact having exited, treatment incomplete”. Worse, I’m told that the label “completed treatment” may not even be assigned at discharge but applied retrospectively on the basis that you did not re-present within the same financial year as discharge occurred in. Oops . . . definitions themselves may be in need of re-presentation.
To mend the gaps in its annual report, NTA would need to adopt a life-table approach to its time-to-event data and to chivvy Ministers in the Department of Health and Home Office to sort the deficit in England’s delay-beset system of registering deaths. Before making claims for recovery, however, NTA, parliament and public need at least to know that its ex-clients survive, and for how long; and what re-presentation rates are after “treatment complete” discharges!
Post-script: Injecting status was declared by the majority (71,518) of new presentations in 2010/11, of whom 38,949 (54 per cent) reported that they had never injected. Comparative data for previous years’ new presentations would have aided understanding of trends across presentation-years.
For three-quarters of clients in contact with structured treatment in 2010/11, prescribing was included in their intervention [for 153,733 out of 204,473 (75 per cent)] but we do not know this information separately for new presentations.

Chris Hughes (not verified) wrote,
Sun, 16/10/2011 - 12:17
As ever the curse of DH (and other) staistics where most information is gathered and shaped by the needs of propriety and regularity to demonstrate that money in the etsimates has been used for the correct purpose and that old friend "the finished consultant episode" (successor to "deaths and discharges") is more important than structuring the infromation gathering to enable serious consideration to be given to the effectiveness of the latest Ministerial initiative.
Deirdre Boyd (not verified) wrote,
Sun, 23/10/2011 - 11:17
Thank you for your excellent analysis!
For an insight into the figures behind the last two years' NTA headlines,go to www.addictiontoday.org and key "Dodgy dossier 1" and "Dodgy dossier 3" into the web-search box.
Sadly, true recovery is not entrenched. To understand how the NTA redefines the dictionary, go to
www.addictiontoday.org/addictiontoday/2010/08/when-is-recovery-not-recov...
Will look at this year's figures and post a brief analysis to you - perhaps you can delve even further!
Keep up the good work,