Squinting hard at the gender pay gap
The Office for National Statistics has determined that the gender pay gap is wider than it previously thought. Yesterday’s statistical bulletin on the Annual Survey of Hours and Earnings puts the gap between median hourly earnings of men and women in full-time work (the preferred measure) at 10.5 per cent, rather than the 9.1 per cent it reported in November.
This is a statistic that is watched carefully by equality campaigners, but the change gives them no particular reason to get excited. It comes, as so often with ONS time series, from a change in the methods by which the figures are calculated.
The latest figures are based on Standard Occupational Classifications 2010, a revised system for classifying jobs which has had a greater effect on estimates of women’s earnings than on men’s. The data is assembled by extrapolating from a sample of 190,000 tax records, around 1 per cent of all workers. It appears that the reclassification shifted more women than men from “managerial” to lower-paid jobs, as SOC 2010 has a more demanding criterion for what a managerial job is.
The problem for the equality-watchers is that it is impossible to recalculate 2010 figures on the new basis, so we cannot be sure that the narrowing of the gap announced last November between 2010 and 2011 actually took place. Mark Williams, the ONS statistician responsible, told the Financial Times he was “99 per cent sure” that was still the case.
Something different struck me about the figures, but it is such an arcane point only statistical nerds need read on.
The data shows that gaps in hourly earnings between men and women are greater if you measure mean earnings than if you measure median earnings (see Table). This makes sense because high-earning individuals push the mean above the median (the distribution is skewed) and more of these high-earning individuals are men. So the skew is greater for men and using mean earnings as the measure makes their advantage over women greater.
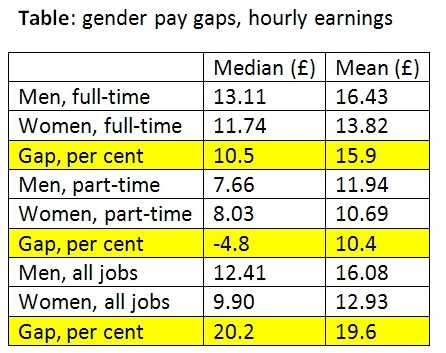
This is true in both full-time and part-time work. The gaps, highlighted in yellow, are greater in both categories – in the part-time category, a 4.8 per cent advantage for women is turned into a 10.4 per cent advantage for men by switching from median to mean.
Yet for all jobs (full-time plus part-time) the gap is greater when measured by the median than by the mean. How can this be?
ONS says it is caused by two factors: the differing composition of the workforce by gender – far more women work part-time than men (42 per cent vs 12 per cent) - and the fact that part-time male employment is more skewed than part-time female employment, due to a larger proportion of high earners among men, such as consultants. “The phenomenon that you have identified is probably down to a combination of these factors” says a helpful statistician from ONS.
And it’s perfectly true that given the breakdown of the working population and a high level of skewness in part-time male earnings, you can create datasets that behave like this.
I’m glad to have had that explained. I wasted hours trying to understand it. Still, I suppose worrying about statistical anomalies is more productive than doing the crossword.

Anonymous (not verified) wrote,
Tue, 27/03/2012 - 22:39
Interesting stuff from the ONS but what they will not tell you - and have refused to come clean about for 20 years - is the marital status implications. From George Gilder in the 1970s to Amneus in the 1990s a direct link between gender / martial status and income levels has been shown. Even Patricia Hewitt's IPPR booklet in teh mid 1990s showed a discrepancy in incomes due to marital status. IMO there will always be a 'gap' no matter how differnces are ironed out or numbers weighted and indexed.